LAYER INFORMATICS provide pre- and post-processing services for photogrammetric data.
Our services include:
Aerial Triangulation is the calculation of true ground coordinates, used as the base reference in Photogrammetry. Aerial Triangulation is the process of densifying and extending ground control through computational means. AT extends horizontal and vertical control from relatively few ground survey control points to each unknown ground point included in the solution. The supplemental control points are called tie points, and they are used to control subsequent photogrammetric mapping. Each stereo model is scaled and leveled using the adjusted coordinate values of the pass points located in the stereo model. Layer Informatics offers complete soft copy aerial triangulation services, providing highly accurate control for the map production. Digital images are uploaded into soft copy workstations. The airborne GPS coordinates and the ground survey control points are used to control the triangulation solution.


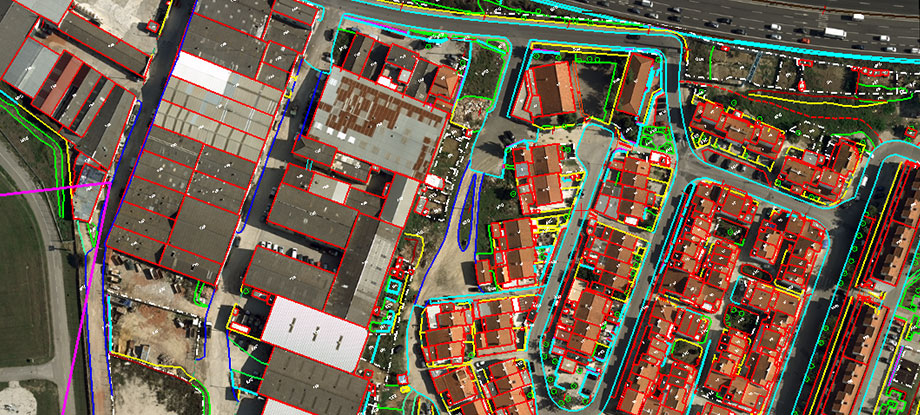
A planimetric map consists of both man-made (cultural) and natural features. These features are represented three-dimensionally as lines (vectors) and points. These features are extracted from aerial photography using modern technology; anything visible in the imagery can be digitized. Common features include:
Useful data can be attached to specific geographic features as part of this intelligent map; for example, in county assessors can embed information about a property’s title, owner, assessed value, and so on. As such, the map / Geographic Information System become a storehouse of valuable data that can be quickly and easily accessed.
As you can see, the overall project cost would be significantly reduced by eliminating the contour component from the mapping. The most important item when selecting mapping features to be produced for a project is to take a careful examination of usefulness and necessity of certain types of data, such as 1-foot contours.


Digital mapping systems contain embedded intelligent data that can be visually interpreted by the user. This data, as part of a Geographic Information System (GIS), can serve many applications. Utility companies can use it to catalog their infrastructures, assessors can use it for property assessment and taxing purposes and engineers can use it to aid in planning upcoming projects. Typical applications include:
Topographic maps depict the three-dimensional shape of the earth’s surface with contour lines at specific intervals to depict the shape and elevation (or relief) of terrain. Topographic maps often portray both natural and man-made features.
Contour intervals are determined based on a client’s specific needs. The smaller the contour interval, the more accurately the map reflects the terrain detail. The purpose of the contour will determine the required contour interval.
In brief, the smaller the contour interval, the lower the photo scale; this results in an increase in the project schedule and cost.


DEM refers to the change in terrain relief or the sudden deviations in slope. Digital Terrain Models, on the other hand, represent the terrain height without the elevations. The DEM points are collected in a regular grid with breakpoints which depict the characteristics of the topography. DEMs are used to draw contours and are an essential ingredient to produce orthophotos.
DTM is the collection of mass points of elevations and 3D breaklines at each change of terrain. The mass points are collected at a grid spacing that meets project requirements. A Digital Terrain Model represents the terrain accurately enough to generate contours that meet specific standards.
Layer Informatics conforms to the proper usage of hard and soft breaklines in all its DTM editing assignments, which ensures very good terrain representation resulting in superior quality orthophotos.


3D City Models are a standard model and mechanism for describing 3D objects with respect to their geometry, topology, semantics, and appearance, and defines five different levels of detail. Included are also generalization hierarchies between thematic classes, aggregations, relations between objects, and spatial properties. It is highly scalable and datasets can include different urban entities supporting the general trend toward modeling not only individual buildings but also whole sites, districts, cities, regions, and countries.
This solution helps in bridging Urban Information Models with Building Information Models (BIM) to improve interoperability among information systems used in the design, construction, ownership, and operation of buildings and capital projects.


Layer Informatics has proven experience in offering Orthophoto Production services and has successfully delivered projects that require Thermal Imagery Processing, RGB & CIR Orthophotography, and Black & White Orthophotography. Orthophoto allows precise calculations of Planimetric distances with real-life representations of the ground areas being measured.
As well as Orthorectification allows elements such as roads, plan views of buildings, railway lines, woodland, rivers, and lakes etc. to be accurately positioned in two-dimensional maps. Digitization and analysis then mean different cartographic layers and filters can be applied with consistent scale and geometry.
